Aegis Limited Noida

How much did Aegis save on Electricity,
Fuel and Water after turning to TEAMS?

A TEAMS Energy Management System Case Study

Industry Overview

chart30

According to Environm Fental Protection
Agency (EPA), 30% of energy used in a
Commercial building is wasted.

chart22

On average, commercial building owners spend around 22% of their opertaional costs on power and water. That's the second biggest line item on most commercial buildings' annual operations cost bills.

chart35

According to EPA, the percentage of building operation costs spend on energy, about 35%, or a little over a third, is spent on lightining alone!

chart40

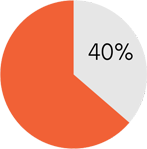
Heating, cooling and ventilating a building (HVAC) accounts for over 40% of a typical building's energy use.

Client Overview

Headquaters,
Aegis Limited, Noida
7 Floor
building
Approximate area of,
340,000 sq.ft
Total employee strength in Noida-
5500 working in 3 shifts.
The major clients serving include:
Airtel, Flipkart etc.

Client Concerns


The TEAMS Diagnosis


3 M Approach

Teams Map

Map-

Where Energy (Electricity, Water and Fuel) is being spent.

Teams Monitor

Monitor-

Consumption in real time and trends.

Teams Manage

Manage-

The Energy Cost and Consumption.

The TEAMS Diagnosis


TEAMS Solution - TEAMS Energy Management System

The single most powerful tool in the Industry taht empowers businesses to significantly lower energy bills and create happier bottom lines!


The TEAMS Roadmap


  1. Property mapping as per energy consumption.
  2. Drawing SLD for major Energy distribution and Consumption.
  3. Complete Automation for Energy Management for property.
  4. Live Electricity Data at 1 hour interval.
  5. Setting budgets against each consumption point.
  6. Providing live monitoring system to monitor and control usage/consumption w.r.t agreed budget.
  7. Trend analysis for:
    • Daily Consumption.
    • Weekly Consumption.
    • Shift Wise Consumption.
  8. Comparitive analysis:
    • Floor wise.
    • Energy Consumption Vs seating capacity/cabin/head count.
  9. Providing live data, monitoring and usage for electricity, fuel and water.
    • Monitoring usage - Area wise.
    • Understand Energy trends.
    • Set budgets.
    • Create alarms once budget exceeds given point.
    • Control usage.
    • Monitor and control losses,thefts, pilferage of fuel and unmonitored electricity.
  10. Calculating DG efficiency as per OEM Standards.
  11. Monitoring fuel efficiency.
  12. Benchmarking water consumption.
  13. Calculating portable water usage as per WHO standards.
  14. Benchmarking and monitoring drinking water bottle consumption as per head count.